How to Build Your First BI Report That Drives Decision-Making in Less Than a Day
In this guide, we'll walk you through the process of building your first BI report from scratch, quickly and efficiently. We'll cover everything from selecting the right data and Business Intelligence reporting tools to designing and deploying your report. Ready to unlock the full potential of your data in just a few hours?
Let's dive in and transform your data into decisions!
Steps to Build Your First-Ever BI Report in Less Than 24 Hours
Step 1: Preparing Your Data for Effective Business Intelligence Reporting
Before diving into the actual creation of a BI report, one of the most crucial steps is preparing your data. This step ensures that the foundation upon which all analyses are built is solid and reliable. Proper data preparation not only enhances the quality of your BI reports but also facilitates smoother, faster reporting processes using Business Intelligence reporting software.
Identifying the Right Data Sources
For effective Business Intelligence reporting, the first step is identifying and consolidating the right data sources. Your chosen data should directly support the KPIs and objectives of your report. It involves a few key considerations:
- Relevance: Ensure the data aligns with the specific analytics goals. Irrelevant data can lead to misleading insights and wasted resources.
- Integrity: Data should be accurate and complete to maintain the credibility of your BI report. This requires validation checks to ensure accuracy and consistency.
- Accessibility: Ensure that the data is readily accessible and that you have the necessary permissions to use it. This often involves collaboration with IT departments or data governance teams to secure access.
Cleaning and Structuring Data
Once the data is gathered, the next step in preparing for use in BI reporting software is cleaning and structuring it:
- Cleaning Data: This includes removing duplicates, correcting errors, and handling missing values. Clean data is critical to ensure accuracy in your BI reports, which directly influences decision-making.
- Data Transformation: Structuring or transforming data into a format suitable for analysis. This might include normalizing data sets, categorizing unstructured data, or creating new variables for deeper insights.
- Consolidation: Often, data comes from multiple sources and needs to be consolidated into a single, coherent set. This step is crucial when using Business Intelligence software tools that pull data from diverse systems like CRM, ERP, or marketing automation platforms.
Automating Data Preparation
To streamline the data preparation process, especially when dealing with large datasets or frequent reporting, automation is key. BI reporting software often includes features that automate:
- Data Integration: Automatically pulling data from various sources and combining it into a single repository.
- Data Cleaning: Tools within Business Intelligence software tools can automatically clean and preprocess data, reducing the time and effort required.
- Scheduled Updates: Setting up scheduled data updates ensures your BI reports are always based on the most current data available, enhancing the timeliness and relevance of insights.
Step 2: Choosing the Right Tools
Selecting the appropriate Business Intelligence reporting software is a critical decision that can significantly impact the effectiveness and efficiency of your BI initiatives. The right tools not only streamline the process of generating reports but also enhance the quality and relevance of the insights you derive.
Understanding Your Reporting Needs
Before exploring the various Business Intelligence software tools available, it’s essential to clearly define what you need from such a tool:
- Specific Functionality: Determine the types of reports you need, the complexity of data analysis, and whether you require real-time analytics, predictive capabilities, or just historical data reporting.
- Usability: Consider who will be using the software. Ease of use is crucial to ensure that business users, data analysts, and BI professionals can all effectively utilize the features without extensive training.
- Integration Capabilities: The tool should seamlessly integrate with your existing data systems and software infrastructure to simplify the data aggregation process.
Evaluating Key Features of BI Reporting Software
When selecting Business Intelligence reporting software, compare the features of various tools to find the best fit:
- Data Visualization: High-quality visualization capabilities are essential for making complex data comprehensible. Look for tools that offer a wide range of visualization options that can be customized to your needs.
- Data Connectivity: Ensure the tool can connect to all necessary data sources, whether on-premises or in the cloud. This connectivity is crucial for creating a centralized reporting environment.
- Scalability: As your business grows, your BI tool should be able to handle increased data loads and more complex queries without performance degradation.
- Security: Given the sensitivity of business data, robust security features are a must. This includes secure data access, compliance with regulations, and data encryption.
Popular Business Intelligence Reporting Tools
Here are some examples of BI reporting software that are well-regarded for their robust features and reliability (note: the selection process should always be tailored to your specific business requirements):
- Grow BI: Known for its user-friendly interface and powerful data integration capabilities, making it an excellent choice for companies looking to implement their first BI tool.
- Power BI: Offers deep integration with other business software tools, extensive customization options, and advanced AI capabilities.
- Tableau: Renowned for its advanced visualization capabilities and strong mobile support, suitable for organizations that prioritize data interaction and sharing.
Trial and Evaluation
Once you have a shortlist of potential Business Intelligence software tools:
- Free Trials and Demos: Most BI vendors offer free trials that allow you to test the software with your data and workflows. Use this opportunity to evaluate ease of use, feature set, and the tool's effectiveness in handling your specific BI tasks.
- User Reviews and Feedback: Consult reviews from current users to understand the strengths and limitations of each tool. Pay special attention to feedback from users in similar industries or with similar use cases.
Making the Decision
After thoroughly testing potential Business Intelligence reporting tools:
- Cost vs. Benefit Analysis: Consider not only the initial cost but also the long-term benefits in terms of increased efficiency and better decision-making capabilities.
Read Do Grow's BI Tool Shows Its True ROI?
- Support and Community: Ensure the tool is backed by reliable customer support and an active user community. This can be invaluable for troubleshooting and learning best practices.
Step 3: Designing Your Report
Designing an effective BI report is a critical step in the process of Business Intelligence reporting. It involves more than just presenting data; it's about making the data accessible, understandable, and actionable for all stakeholders involved. This section provides a comprehensive analysis of the key principles in designing a BI report, ensuring the content is insightful and actionable, catered to business users, data analysts, and BI professionals. The use of Business Intelligence reporting software plays a crucial role in achieving these objectives by providing the necessary tools and features to create impactful reports.
Understanding Your Audience
The design of your BI report should be tailored to the needs and expertise of its audience:
- Business Users: Focus on high-level summaries and key metrics that impact business decisions.
- Data Analysts: Include detailed data explorations and the ability to drill down into more specific datasets.
- BI Professionals: Provide technical insights, data lineage, and performance metrics.
Understanding the needs of your audience ensures that the BI report created using Business Intelligence software tools is relevant and useful, enhancing decision-making processes across all levels of the organization.
Choosing the Right Visualizations
Selecting the appropriate visualizations is crucial in making your data comprehensible and engaging:
- Bar and Line Charts: Ideal for trends and comparisons over time, making them a staple in many business reports.
- Pie Charts: Useful for showing proportions and percentages but should be used sparingly to avoid clutter.
- Heat Maps and Geographical Maps: Excellent for visualizing data distributions and regional metrics.
- Dashboards: Combine multiple visualizations in a single view, providing a comprehensive snapshot of performance.
Business Intelligence reporting software typically offers a wide range of visualization tools that can be customized to fit the specific needs of your report, ensuring clarity and effectiveness in data presentation.
Layout and Structure
The layout of your BI report is just as important as the data it contains. A well-structured report enhances readability and user engagement:
- Logical Flow: Arrange information in a logical sequence from the most to the least important.
- Consistency: Use consistent colors, fonts, and styles throughout the report to aid in recognition and understanding.
- Highlight Key Points: Use colors or fonts to highlight critical data points or insights, making them stand out in the report.
BI reporting software provides templates and layout tools that help in organizing data effectively, making the reports easier to navigate and interpret.
Interactivity and Usability
Interactivity enhances the usability of BI reports by allowing users to explore data in a more engaging way:
- Drill-Down Capabilities: Enable users to click on report elements to view more detailed data, providing a deeper understanding of the metrics.
- Filters and Selections: Allow users to customize views according to their specific needs or areas of interest.
- Responsive Design: Ensure that the report is accessible and usable across different devices, particularly mobile devices, which are increasingly used in business settings.
Business Intelligence software tools often include features that support interactivity, making the reports not just informative but also adaptable to user needs.
Step 4: Building the Report
Building an effective BI report involves more than just gathering data; it requires careful planning, execution, and customization to ensure that the final report delivers actionable insights in an accessible format.
1: Importing Data
The first step in creating a BI report is importing the data you need to analyze. Usually, this method includes a few main steps:
- Identify Data Sources: Determine where your data is coming from, whether it's internal databases, spreadsheets, or cloud services. Business Intelligence software tools often support a wide range of data sources, enhancing their versatility.
- Connect to Data Sources: Use the BI reporting software to establish a connection to these sources. This might involve entering credentials, selecting databases, or specifying data import criteria.
- Data Import: Execute the data import process, which involves loading the data into the BI tool. Ensure that the data is correctly imported by verifying sample data points.
2: Selecting and Configuring Visualizations
Once your data is imported, the next step is to select and configure the visualizations that will make up your report:
- Choose Appropriate Visual Types: Depending on the nature of the data and the insights you wish to convey, select from a variety of charts, graphs, and tables. Common choices include bar charts for comparisons, line charts for trends, and pie charts for distribution.
- Customize Visuals: Adjust the aesthetics of your visuals to improve clarity and impact. This can include setting color schemes, adjusting scales, and labeling axes. BI reporting software typically provides a range of customization options to suit your needs.
- Arrange Visuals: Organize the visuals on the report canvas. A logical arrangement that follows the narrative of your data will help users better understand the insights.
3: Customizing with Filters and Drill-Downs
To enhance the interactivity and relevance of your BI report, incorporate filters and drill-downs:
- Implement Filters: Filters allow users to refine the data displayed in the report based on specific criteria, such as dates, geographic regions, or product categories. Set up filters that are relevant to your audience’s needs.
- Configure Drill-Downs: Drill-downs enable users to click on elements of your visuals to see more detailed data. This feature is particularly useful for revealing granular details that support broader trends and patterns observed at higher levels.
- Test Interactivity: Ensure that all interactive elements function as intended by conducting thorough testing. Check that filters and drill-downs update the visuals correctly without errors or significant delays.
Step 5: Testing and Deployment
Before deploying the report:
- User Testing: Invite a group of end-users to test the report’s functionality and provide feedback on its usability and effectiveness.
- Iterate Based on Feedback: Use the feedback to make necessary adjustments to the report design, visualization settings, and interactivity features.
Testing and iterating are vital components of creating effective Business Intelligence reports. By utilizing Business Intelligence reporting software, businesses can ensure their reports are accurate, functional, and tailored to meet user needs. This process involves rigorous functional testing to verify data accuracy and visualization integrity, followed by user acceptance testing to gather feedback from a range of users, from business managers to BI professionals.
Iterative refinements, supported by the advanced capabilities of Business Intelligence software tools, allow for the continuous enhancement of the report based on user feedback and changing business requirements. This cyclical process ensures that BI reporting remains a robust and dynamic tool for informed decision-making within an organization.
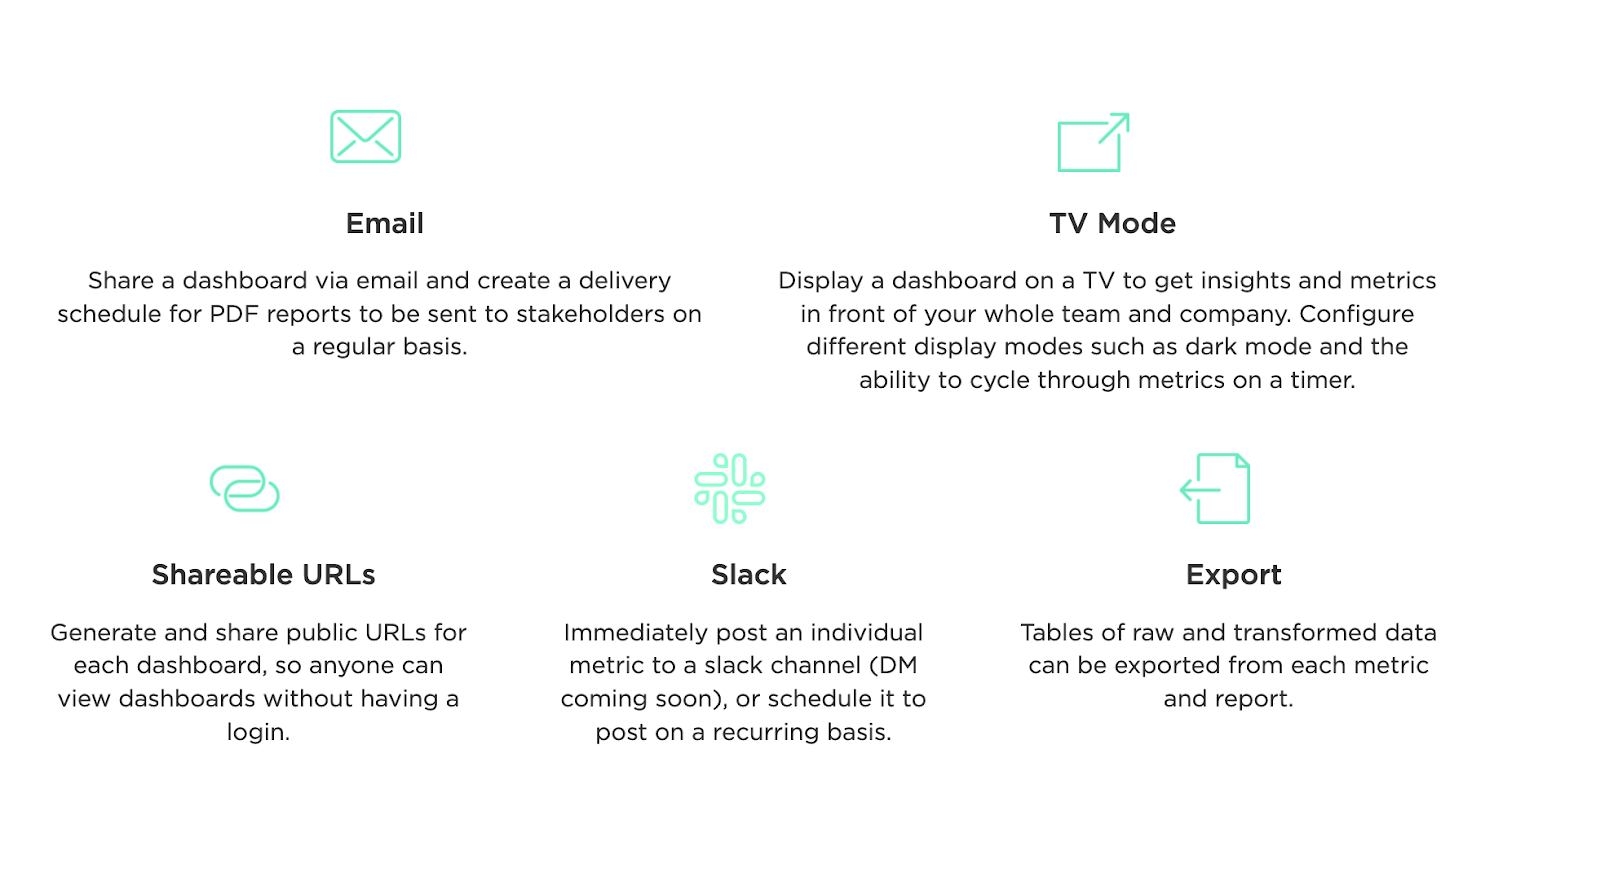
Step 6: Deploying and Sharing the Report
Deploying
and sharing your BI report effectively is the final, crucial step in
the Business Intelligence reporting process. Utilizing BI reporting
software, businesses can distribute reports securely and efficiently
across different departments and stakeholders. This phase ensures that
the insights generated by Business Intelligence software tools are accessible to all relevant parties, facilitating informed decision-making throughout the organization.
Deployment strategies may include setting up automated report distributions, integrating reports into common platforms used by the business, or utilizing features in the BI reporting software that allow for real-time data updates and collaborative review, ensuring that the information remains current and actionable.
Conclusion
Building your first BI report within a day might seem like a daunting task, but with the right approach and tools, it's entirely feasible and can significantly enhance your decision-making capabilities. By following the structured steps outlined—from understanding the basics of BI reporting and preparing your data, to choosing the right tools, designing, and finally testing and deploying your report—you can create a powerful tool that provides valuable insights into your business operations.
A key factor in this rapid development process is choosing user-friendly and powerful Business Intelligence reporting software. Grow is an excellent example, offering robust features that simplify the BI reporting process. Grow's intuitive interface and comprehensive toolset allow you to streamline data integration, visualize analytics effectively, and customize your reports with ease, making it an ideal choice for those looking to get started with BI reporting.
To see how Grow can transform your data into actionable insights, take advantage of the 14-day free trial. This trial will give you full access to all of Grow's capabilities, enabling you to experience firsthand how simple and effective building and deploying BI reports can be.
For more information and user reviews, visit Capterra's listing for Grow.com. Discover how other businesses like yours are using Grow to drive their decision-making processes and achieve greater outcomes.
Start your journey towards data-driven decision-making today with Grow, and build your first BI report in less than a day.


Comments
Post a Comment