How To Choose The Best Data Analytics Software?
Data analytics may sound a bit tricky to most. It is tough and takes plenty of time to master evaluating the data correctly to derive valuable insights for your organization.
Various data analytics tools available in the market can make your life easier. But what exactly is the broad domain of data analytics.
Let's understand this first.
What is Data Analytics?
Data analytics involves using data, Machine Learning, statistics, and many other computer-related models to develop better insights for your business. Naturally, it will lead to accurate decisions and improve the functioning of your organization.
One can define analytics as a process that transforms data into decisions and is further involved in problem-solving for better productivity.
Let’s see how to choose the suitable data analytics software that meets your company’s needs.
What are the things to consider before choosing a Data Analytics Software?
1. Data Structures
Always see what kind of data your team will require, the number of sources, and how you'd like data analytics and visualization software to present it.
The data analytics software should be competent enough to take care of unstructured data with quantitative analysis tools supporting major data types.
Powered by relevant data visualization tools meeting the data-at-a-glance needs of your organizational teams. Research your alternatives in-built with statistical analytics tools if you're into advanced statistical formulas to help with numerical or binary data.
2. Pricing
Being a unique and innovative subset of Business Intelligence(BI) software, data analytics and visualization capabilities are expensive. The advanced features come with quality visualizations, modern formula templates, and high computational power.
Naturally, analytics tools with a data visualization dashboard having ready to take action using the insights provided. However, if you are short of budget, your company can opt for open source tools that are available free of cost.
3. Check for integrations
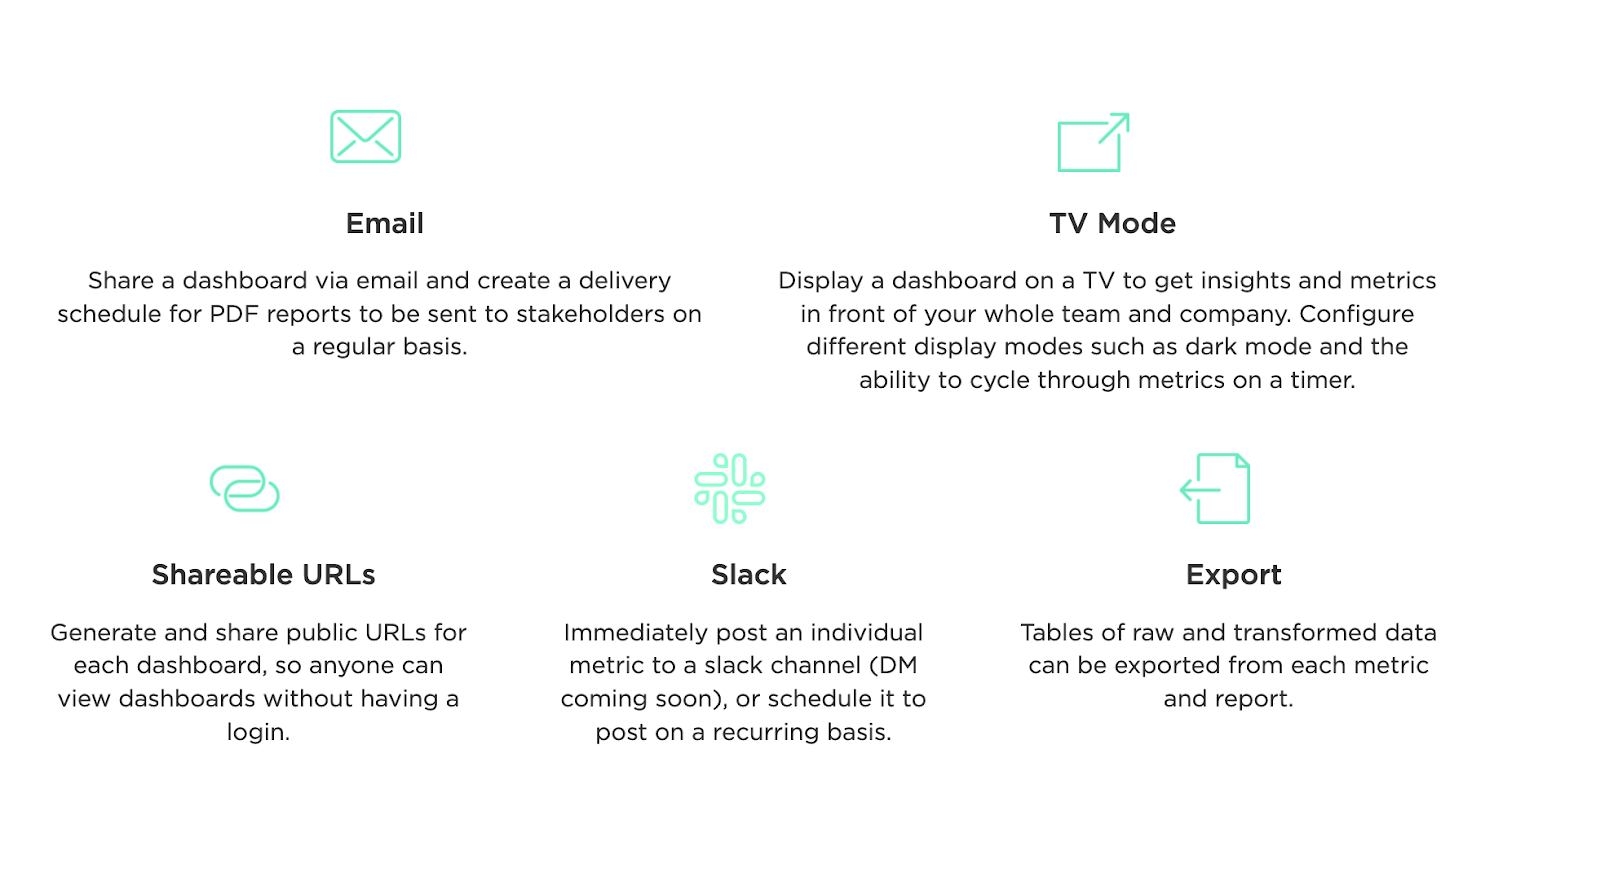
The analytics tools should readily integrate with your existing framework and also extend to connect your databases securely. The data visualization tools should be able to present the compiled information in a manner most beneficial to your teams.
Because, in the end, your data analytics and visualization tool will only be as effective as the reports presented in them for actionable insights.
4. Customized visualizations
The data visualization tools often have limited customizations for the manner in which it presents data in the interface. The more the number of customizations is available, the more teams and departments can use it to fit the same information as per their specific needs.
Try various combinations of charts, graphs, and tables to view data, adding maximum value to your team's decision-making process.
Closing words-
It will always depend on the data needs of your teams when it comes to choosing the best data analytics and visualization tool for your company. There will be options that might meet your budget but do not cater to your needs. Compromising once with software quality can compromise the integrity of your organization's overall critical decisions and revenue growth.
Choose Grow's data analytics software to change the way your organization functions at all levels and discover opportunities never before heard.

Comments
Post a Comment