6 Key Benefits Of A Business Dashboard Software
Data has become the backbone of decisions that will turn around the organizations entirely. Businesses and their leaders have long understood this. As a result, companies have started relying on Business Intelligence technologies to evaluate vast data and automate and simplify the tedious process.
A business dashboard software is beneficial for industries in many ways. Since they are visual information tools, company members can display the relevant data and convey information seamlessly.
What distinguishes a well-designed Business Intelligence dashboard from an ineffective one is how it represents the company information and the suite of customization it offers for presentation.
In short, poor quality and difficult-to-understand dashboards can restrict the effectiveness of BI tools. Let's look at the key benefits of a BI dashboard in the everyday functioning of companies.
What are the benefits of Business dashboard software?
1. Saves BI time
BI teams or departments take care of the BI needs of companies, but this isn't the only task they're supposed to undertake. Suggesting new ways to present data in the form of charts and graphs and finding new ways of building reports also add to their to-do list.
When the Business Intelligence data visualization tools are automatically updated, the team has more time to analyze and help interpret data, trends, and patterns in the data analyzed.
2. Improve productivity of end-users
The autonomy and independence of the end-users of a business dashboard software are incomparable. BI dashboards can simplify the process of understanding complex information and get ready solutions for the answer they're looking for.
The users may belong to a non-technical background but don't have to wait for the BI team to show up and help them through the data.
3. Customization in features
Several value-added features help organizations to figure out what they expect in terms of efficiency from the Business Intelligence software vendors. With the assistance of the vendors' expertise, try to find out which features will suit your organizational hierarchy and which will lie flat unused.
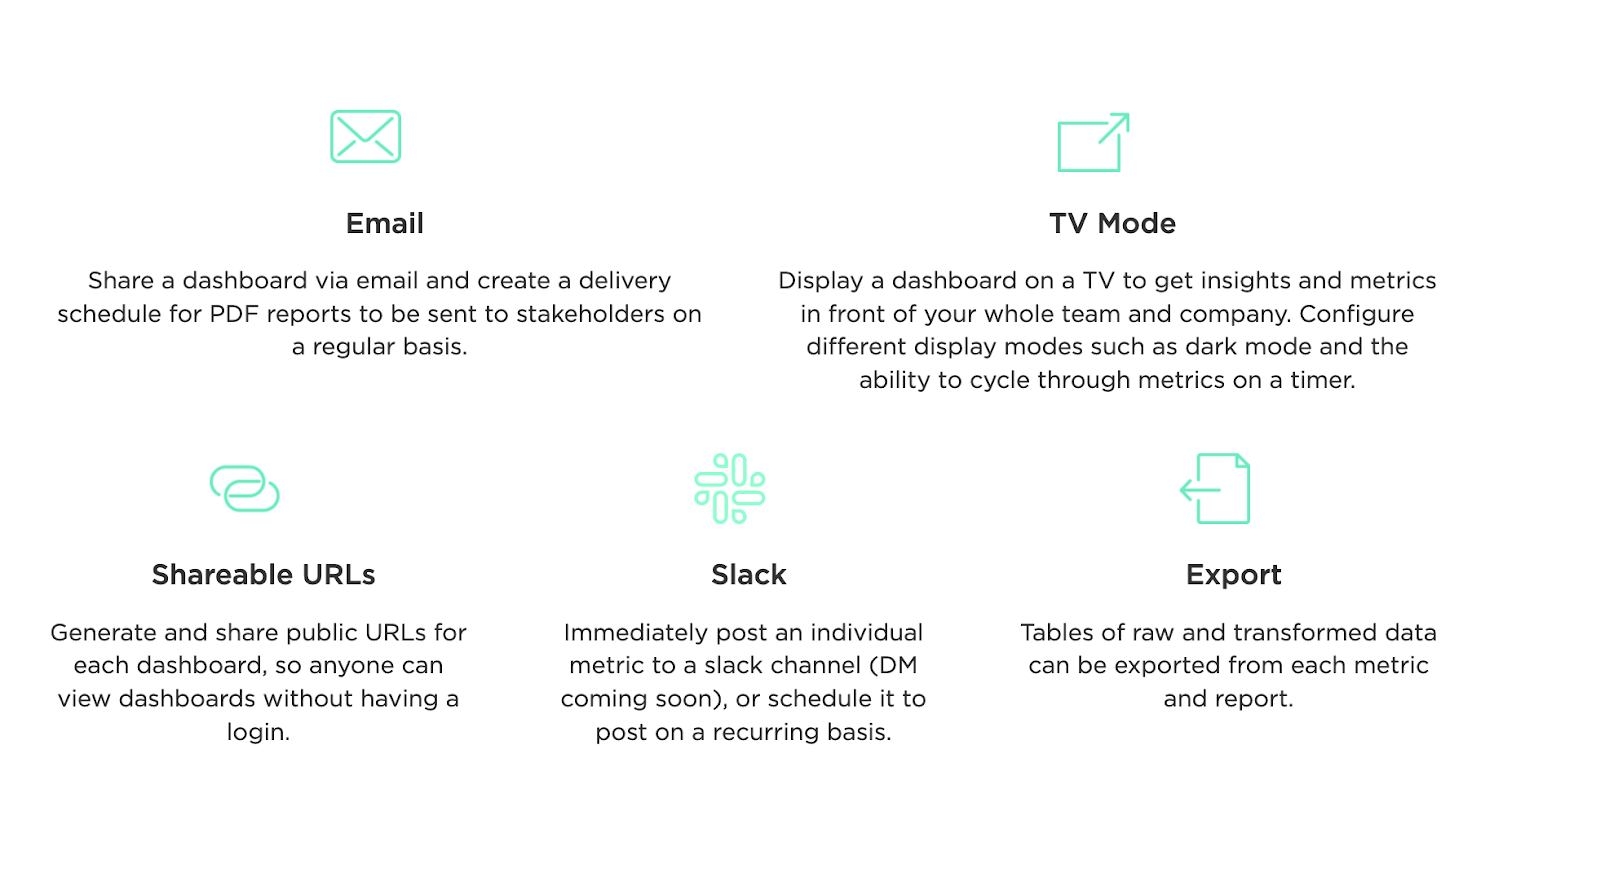
A cloud-based platform will help keep all the company members in the loop and enable access to critical information in real-time. Therefore, the BI dashboard should be mobile responsive as the teams might access it anywhere.
4. Multiple sources of information
This is probably one of the best features of a Business Intelligence data visualization tool. Manually, collecting data from a diversity of sources and connections is impossible. Importing such massive data will require excessive time and effort from the companies. What comes easy here is the ability of the Business Intelligence technologies to import and refresh data for easy conversion into metrics.
5. Highlights the KPIs
Quick and practical insights to improve the business processes are the key results of BI dashboards. The best dashboards offer immediate understanding and form the basis of successful strategic decisions in less time.
The Key Performance Indicators(KPIs) are fundamental to taking accurate leaps into any industry. They help evaluate past performances and establish benchmarks for future courses of action.
Business Intelligence software vendors should provide dashboards that offer clearly visible information to all the team members, whether with technical backgrounds or not.
6. Identifying trends and patterns
BI dashboards are simple tools to identify the necessary shifts in data trends and patterns. Dashboards lay out KPIs in a manner that helps predict future trends by studying the past occurrences in the data. It helps in effectively assessing the market conditions.
The organizations can better adapt, avoid issues from escalating, or altogether prevent the situation from happening.
Closing words-
Using Grow's suite of Business Intelligence technologies, anything is possible in the world of data. Connect with us to transform the way your organization functions.

Comments
Post a Comment