How Does A KPI Dashboard Benefit Business Decision-Making?
Key Performance Indicators(KPIs) are more than just numbers and metrics for your weekly report. They help you understand the performance of your business so that you can achieve your benchmarked goals. Knowing your KPIs will help you measure them more effectively.
Imagine what the right KPI dashboard can do to the productivity of your business! Let’s understand it closely.
What is a KPI dashboard?
Key Performance Indicators(KPIs) can help establish the needs of your business and track your performance against them. What's more valuable than a BI software (Business Intelligence software) having interactive dashboards for your team members with relevant KPIs for comparison and analysis.
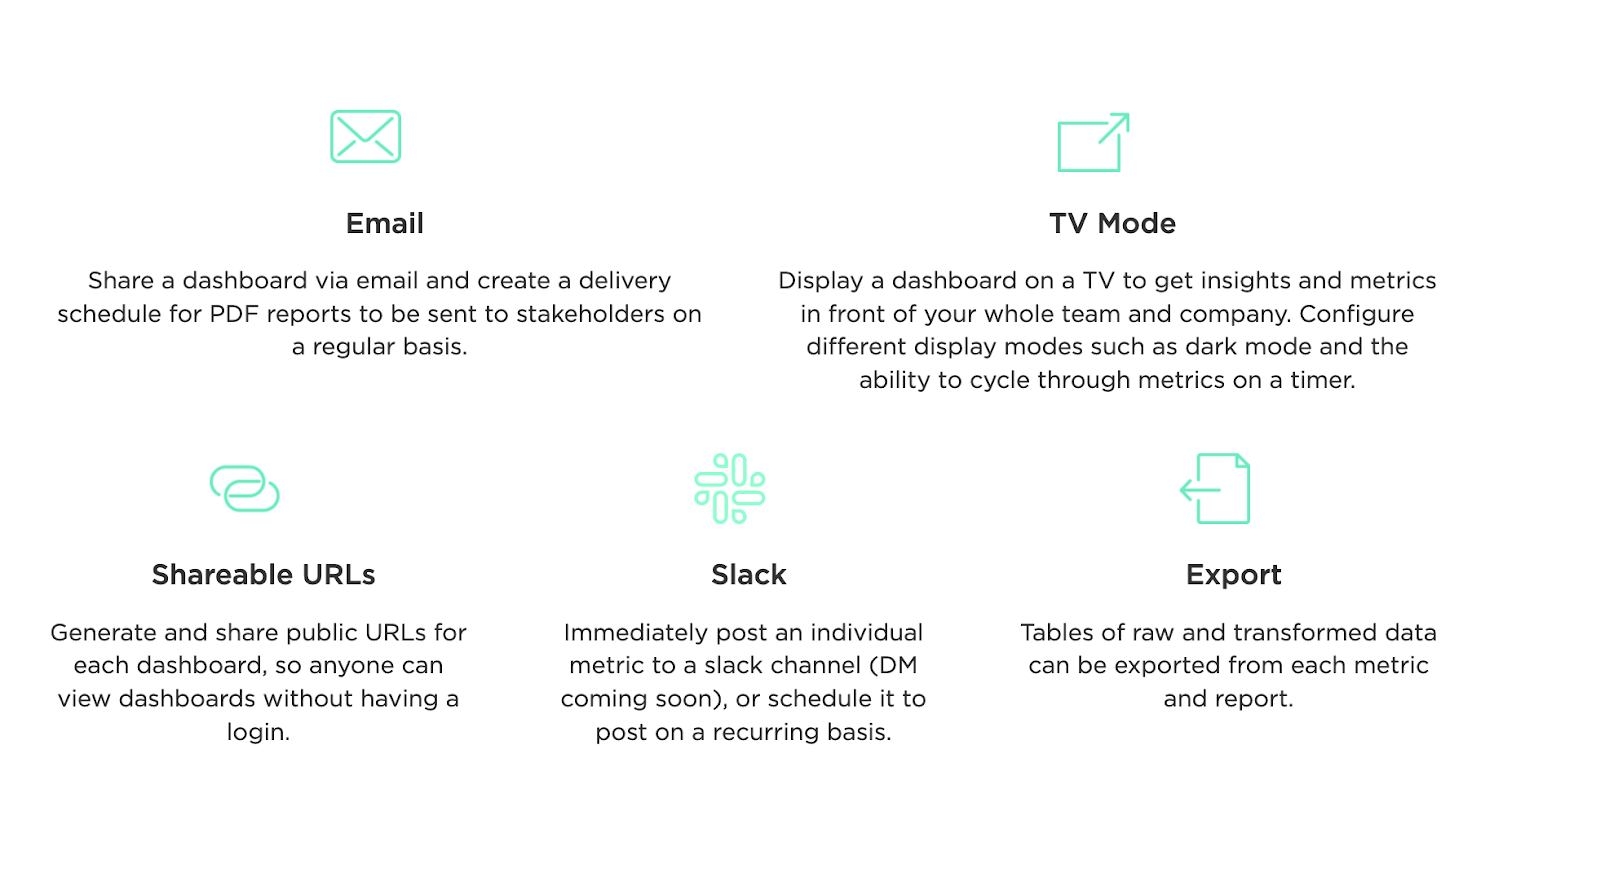
For the Business Intelligence tools to be effective, they should have dashboards, which can be organized, filtered, analyzed, and ultimately visualized as powerful data storytelling means.
It's easy to view and compare your data side by side. It takes an excellent KPI dashboard to translate a vast amount of complex and disparate data into an easy and understandable form.
What are the advantages of a good KPI dashboard in BI tools?
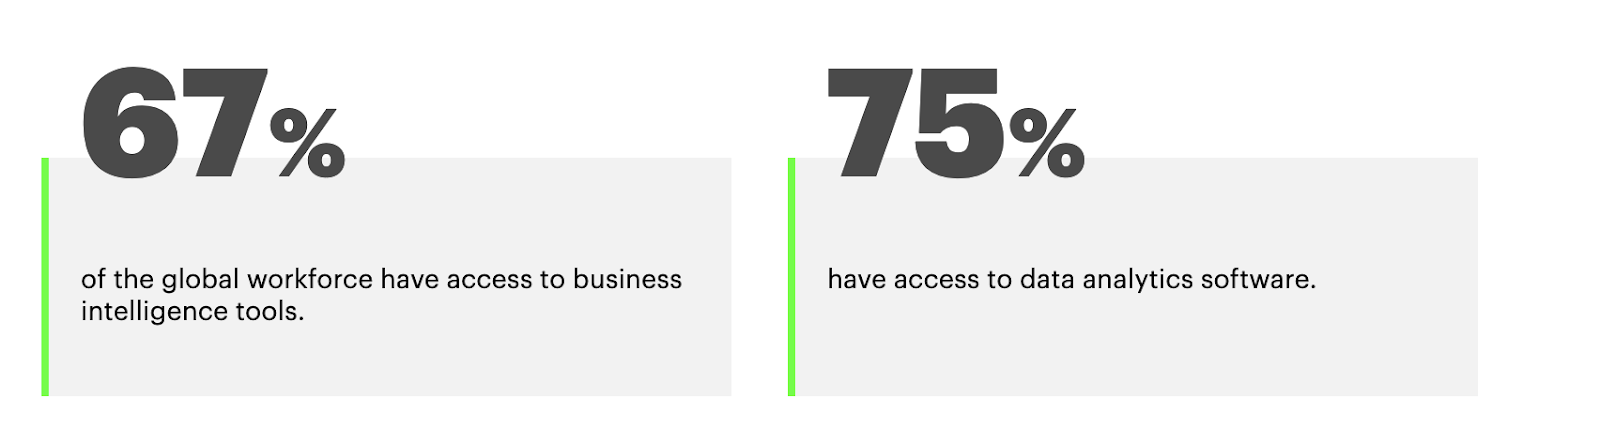
With modern analytics solutions at their disposal, users can access embedded analytics, natural language, and automated business monitoring.
Unified Business Intelligence tools can quickly answer high-priority questions without errors. Let's look at some of the ways BI software is helping organizations make better decisions.
1. Deeper Insights:
An efficient KPI dashboard helps users organize, filter, dig deeper and find valuable insights that the companies can visualize in front of the teams. These highly interactive display of a business's key targets in any given area helps understand complex numbers at ease.
It helps cut through non0curated, unfiltered datasets to a systematic representation of performance.
2. Identify significant issues early:
Having an organized KPI dashboard assists in arranging critical metrics that best allow users to form opinions at a glance. With the ability to immediately determine outcomes using the metrics in BI software, the company can swiftly figure out the priority areas and take instant remedial actions as and when required.
3. Real-time ROI Analysis:
The decisions which involve leveraging the company's ability to decide which investments worked well for it in the past and by what ratio are easily identified. It helps in proactive company analysis to drive better financial outcomes in the long run.
This is the most crucial point to answer people's questions such as 'what is Business Intelligence' and 'how can BI tools help in better investing the funds?'.
4. Trends and Opportunites:
A KPI dashboard can help spot noticeable patterns in the sea of continuously collected and stored data from various sources, which, if not humanly possible, will drain major resources. Identifying market opportunities earlier and predicting trends can charter the way for growth and better align the organizational objectives to changing times.
Final Words-
KPIs are the driving metrics toward a company's better future. With the need to secure an upper hand in an increasingly competitive industry, access to a robust KPI dashboard makes all the difference.
Grow offers low-code Business Intelligence tools that can help leverage the company's strengths and push the personnel to maximize its potential with smart efforts. Have a closer look at our BI software functionalities and secure a better future for your firm.

Comments
Post a Comment