How A Dashboard Tool Can Enhance Your Jira Experience
In
the dynamic world of project management, keeping track of ever-changing
tasks, deadlines, and resources can be a challenge, akin to navigating a
ship in stormy seas.
While
Jira, Atlassian's flagship project management tool, has been a reliable
compass for many teams, a clearer and more panoramic view of the
journey ahead is often needed. And that's precisely where dashboard
tools come into play.
In this blog post, we're going to explore how a dashboard tool can turbocharge your Jira experience, making it not just a compass but a fully equipped navigation system.
The Power of Jira for Project Management
Jira's ability to adapt to any agile project management methodology, along with its extensive customization options, has made it the tool of choice for teams around the globe. It's robust issue-tracking and project management capabilities help teams stay in sync, keeping everyone on the same page, quite literally.
However, as rich as Jira is, sometimes teams struggle to see the 'bigger picture.' That's because while Jira is excellent at tracking individual issues, it can be challenging to visualize overall progress, identify trends, or draw insights from the raw data. This is where a dashboard tool steps in to elevate the Jira experience.
The Role of Dashboard Tools
Dashboard tools are the lenses that bring the data into focus. They help translate raw, often scattered data into visual, intuitive, and interactive formats, making it easier to track progress in real-time, understand trends, and make data-driven decisions.
More importantly, they provide the ability to aggregate data from different sources, offering a unified view and thereby enabling teams to grasp the entire project's status at a glance. This holistic view can be instrumental in spotting potential roadblocks, identifying bottlenecks, and planning effectively.
Enhancing the Jira Experience with Dashboard Tools
Integrating a dashboard tool with Jira can create a powerful project management environment.
Visualization of Data
One of the most immediate and striking benefits of integrating dashboard tools with Jira is the ability to visualize data in a user-friendly, interactive manner.
The traditional tabular data presentation within Jira, while valuable, can sometimes become overwhelming, especially when handling large-scale projects involving hundreds or thousands of issues.
Grow's BI dashboard tool, for instance, transforms Jira's data into visually engaging and understandable charts, graphs, and tables. Users can instantly grasp project status, progress, and potential bottlenecks, enabling more informed decision-making.
Real-time Data Monitoring
With the help of dashboard tools, project teams can monitor the progress of tasks in real-time. Grow's dashboards refresh automatically, ensuring that managers have access to up-to-date metrics like open issues, closed issues, work-in-progress, and average resolution time. This facilitates quick and informed decision-making.
Customizable Dashboards
Most dashboard tools offer a high level of customization. Teams can create their own dashboard views, focusing on the data that matters most to them. This could include anything from the status of specific tasks to high-level project progress. Such customization enhances the personalization of the Jira experience and boosts productivity.
Grow's dashboard customization goes beyond just selecting which metrics to display. It enables users to decide how they want the data to be presented, offering various visualization options, from simple pie charts to complex multi-dimensional graphs. It also allows using colors, labels, and filters to make the data more readable and understandable.
Let's take the example of a team working on a software development project. They might want to track different metrics, such as the number of open bugs, the average bug resolution time, the number of completed tasks per sprint, and the workload distribution among team members. With Grow, they can create a unique dashboard that encapsulates all this information in a visually engaging and accessible manner.
In
addition to building dashboards from scratch, Grow offers a library of
pre-built templates. These templates cater to various use cases and
industries, providing a great starting point for teams new to BI
dashboards. They can use these templates as-is or customize them to
better suit their specific needs.
Moreover, Grow's dashboards are not static; they are dynamic and interactive. Teams can drill down into the data directly from the dashboard to gain deeper insights. For instance, if a project manager notices an unusual spike in bug reports, they can click on the data point to see more detailed information, like which part of the project these bugs are coming from or who is assigned to them.
Custom dashboards also promote transparency and foster a sense of ownership among team members. When each member can see how their tasks contribute to the overall project and where they stand in real-time, it leads to increased accountability and engagement.
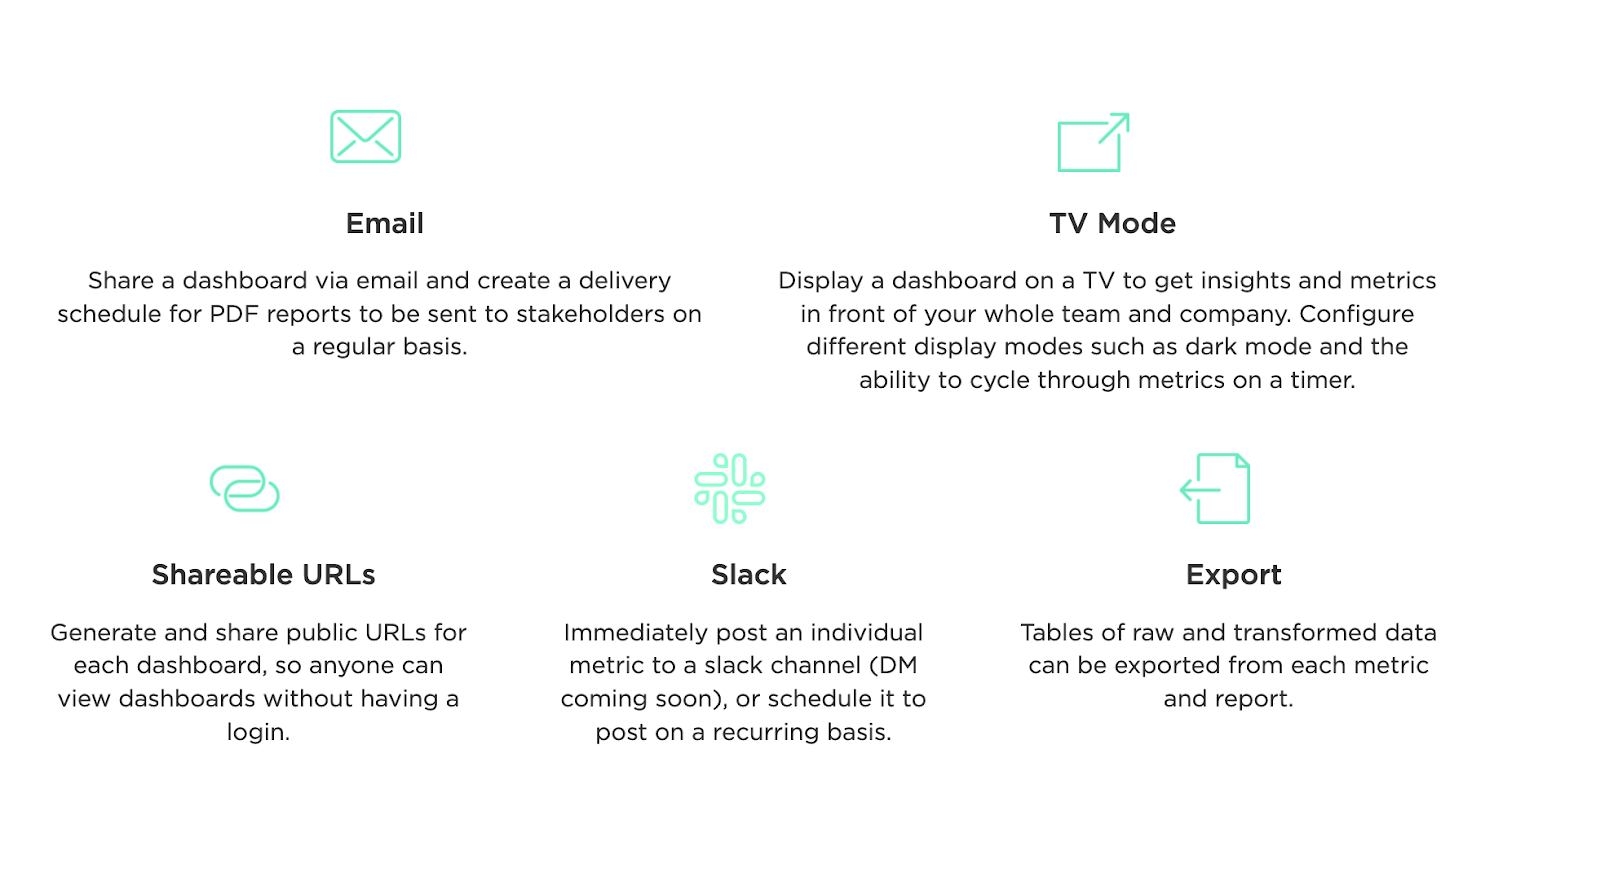
Enhanced Collaboration
Dashboard tools can also foster collaboration among team members. By maintaining a shared dashboard that everyone has access to, team members are constantly aware of the project's status and the progress of their peers. This promotes transparency and can help teams work together more effectively.
Advanced Reporting
While Jira itself has reporting capabilities, integrating with a dashboard tool
takes this to the next level. Not only can teams generate comprehensive
reports detailing the current project status, but they can also create
predictive reports based on current trends and historical data.
Grow's advanced reporting capabilities go beyond merely showcasing project statistics. It also allows users to leverage historical data to identify trends, patterns, and correlations. For instance, a team can identify if there are certain times in a project cycle when bugs typically peak or if specific tasks consistently take longer than anticipated. By recognizing these patterns, teams can proactively change their process, improving efficiency and productivity.
Better Resource Management
Dashboard tools can provide a clear view of how resources are being utilized within a project. For instance, a project manager may notice that one developer is handling a significantly higher number of tasks than others or that a particular team member is consistently working overtime. These insights, which might have been overlooked in the conventional task lists of Jira, become conspicuous with Grow’s visual dashboards, enabling timely intervention and redistribution of tasks.
Grow's business intelligence dashboard also assists in capacity planning. By integrating data on team members' availability, ongoing tasks, and upcoming projects, project managers can estimate their team's capacity and plan future tasks more effectively. This helps in setting realistic deadlines and avoiding over-commitment.
Furthermore, Grow’s business dashboard software can provide insights into task performance. By analyzing the time taken to complete different types of tasks and the frequency of blockers, teams can identify areas of inefficiency. For example, if a particular task consistently takes longer than estimated, it could indicate a need for additional training or process improvement.
Moreover, with Grow’s business intelligence dashboard, tracking the performance of remote or distributed teams becomes simpler. Managers can monitor task progress, workload distribution, and time utilization across different time zones or locations, ensuring smooth and efficient operations regardless of geographical boundaries.
How to integrate Dashboard Tools with Jira
While the specifics can vary depending on the dashboard tool, the integration process typically involves installing an add-on or plugin, configuring the dashboard to connect with Jira, and customizing your dashboard views.
Start by identifying the data you want to visualize. Then, explore your chosen tool's documentation to understand how to map this data onto the dashboard best. Remember, the goal is to enhance visibility and generate actionable insights, so keep your dashboard business intelligence simple and focused.
Integration can sometimes be tricky, with common pitfalls like incorrect data mapping, connectivity issues, or overcomplicating the dashboard. Be prepared to troubleshoot and refine your dashboard business intelligence over time. Most importantly, keep your team's needs front and center.
If you still have trouble integrating Jira with Grow dashboard tool, learn more here.
Conclusion
By seamlessly integrating dashboard tools with Jira, teams can transcend traditional project management limitations, gaining the ability to visualize, analyze, and respond to project trends in real-time. It's like turning on the headlights in a night drive, providing the much-needed visibility to navigate complex project landscapes effectively.
But all dashboard tools are not created equal. When choosing one, look for features like real-time data updates, customizable data views, and compatibility with Jira. Additionally, consider how intuitive the tool is and whether it allows you to export or share your dashboards with others. So, why not go with Grow’s Business Intelligence dashboard?
Ready to try it out? We encourage you to explore integrating our best dashboards software with Jira and experience the transformation. Check out Grow Features & Capabilities GetApp. Feel free to share your experiences, success stories, or any questions you might have. After all, the journey to effective project management is one we're all on together. Happy navigating!

Comments
Post a Comment