How to Create BI Reports That Actually Get Read: A Step-by-Step Guide

This idea from 2 Brothers Moving & Delivery brings to light an important truth in the field of Business Intelligence: the power of strategically making data reporting easier.
But how did a service-oriented mover in Portland, Oregon, leverage BI to not just track data, but truly understand and act on it? And what can your business learn from their journey?
Imagine the potential of transforming overwhelming data into a focused dashboard that everyone from the ground up can understand and use. For the 2 Brothers, this wasn't just a dream; it became their reality.
They shifted from complex spreadsheets to a streamlined dashboard that highlighted key performance indicators, making data accessible and engaging for the entire team.
"The implementation is so easy. An account rep holds your hand through the setup, and there’s even a conference to teach you how to use it," Sweet remarked about their transition to Grow.
But it wasn't just about making data easier to digest. It was about driving a culture of performance and transparency. With data now visibly displayed on office leaderboards, 2 Brothers saw a surge in positive energy and healthy competition among their team. Information that was once hidden in spreadsheets became a source of motivation and clarity.
So, ask yourself, could your BI reports use a transformation? Are you leveraging your data to its fullest potential, fostering an environment where everyone is aligned and motivated by clear, accessible insights?
Let's dive deeper into how simplifying and strategically presenting your data can revolutionize the way your business operates, just like it did for 2 Brothers Moving & Delivery. It's time to make your data work for you, not against you.
How to Create BI Reports That Actually Get Read: A Step-by-Step Guide
Step 1: Understanding Your Audience
Before diving into data or design, the first step in creating impactful BI reports is to understand your audience.
Whether your report is for C-suite executives, departmental managers, or operational teams, recognizing their information needs and decision-making processes is crucial. This knowledge shapes the content, format, and complexity of your BI reporting. Tailoring your reports to the audience's preferences ensures that your BI efforts align with their expectations, making the insights you provide both relevant and actionable.
Step 2: Setting Clear Objectives
Clear, defined objectives are the foundation of effective BI reporting. Establishing what you aim to achieve with each report guides your data selection and analysis. Employ SMART objectives to ensure your BI reports are focused and meaningful.
For instance, a sales report objective might be to "Increase monthly sales by 10% by identifying the top-performing products and sales regions." This clarity helps in selecting the most relevant data and focusing your analysis on where it can have the greatest impact.
Step 3: Selecting the Right Data
With a plethora of data at your disposal, selecting the right data is more than important. The data you choose should directly support your report's objectives, providing clear insights into the issue at hand. This step requires a balance—while comprehensive data analysis can uncover hidden trends, simplicity ensures your BI reports remain accessible.
Utilizing Business Intelligence reporting tools effectively can streamline this process, ensuring that you're working with high-quality data that enhances the report's trustworthiness.
Step 4: Designing for Clarity and Impact
The design of your BI reports play a crucial role in their effectiveness. Utilizing BI reporting tools, you can choose the right chart types, color schemes, and layouts that make your data accessible and engaging.
A well-designed report uses visual hierarchy to guide readers through the data, emphasizing key findings and making complex information understandable at-a-glance. Annotations, executive summaries, and data highlights can further draw attention to the most critical insights, making your BI reporting impactful.
Step 5: Making It Interactive
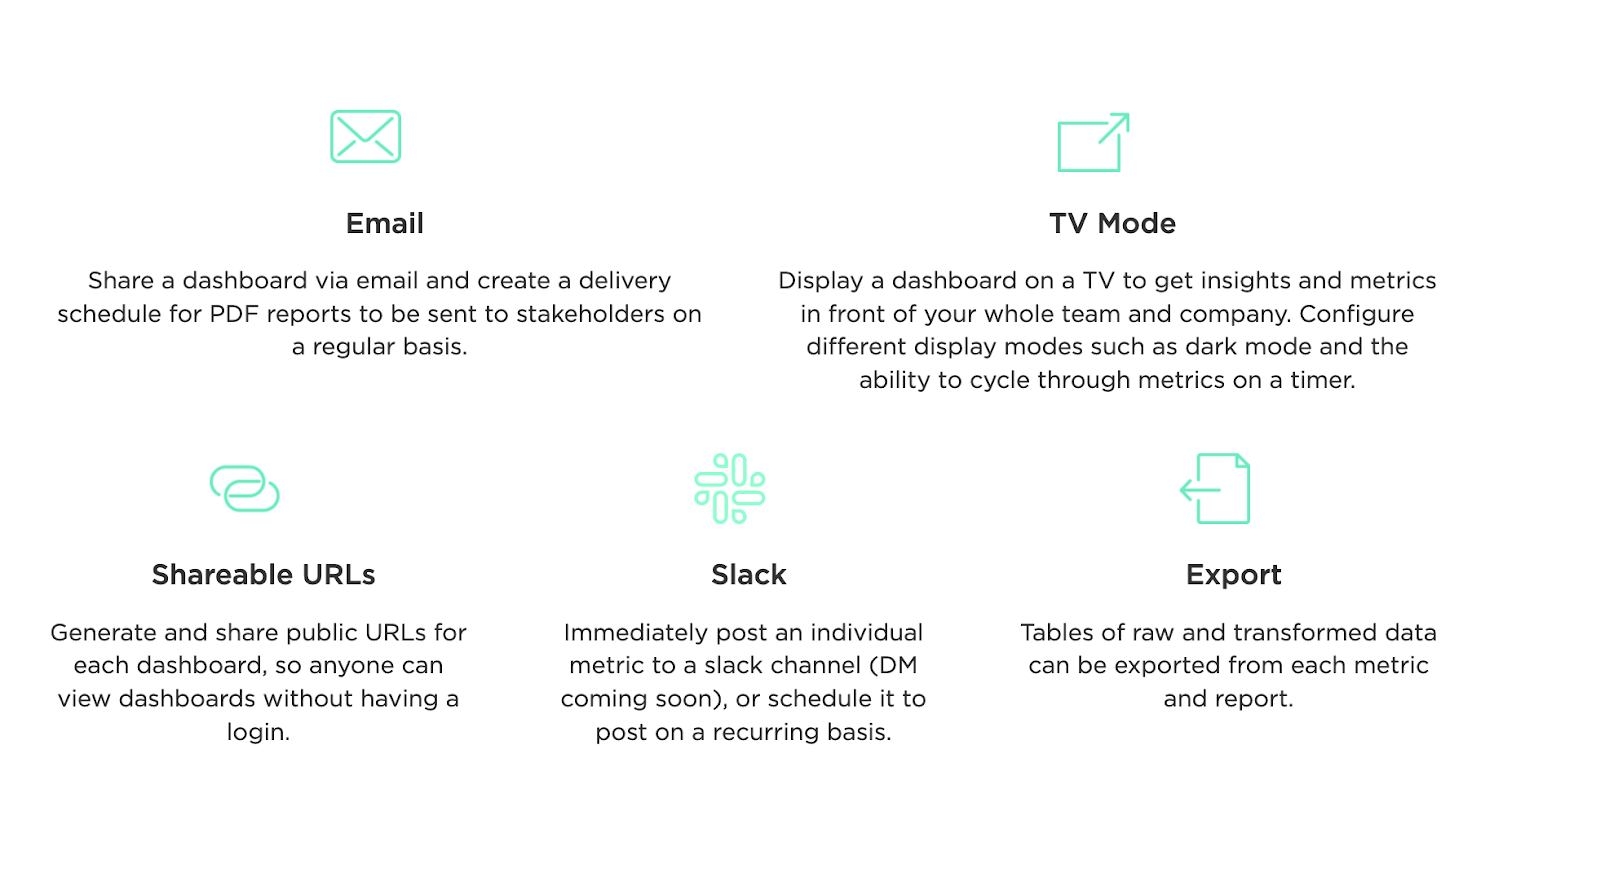
Interactive BI reports engage users by allowing them to explore data in a way that static reports cannot. Features like drill-downs, filters, and interactive dashboards encourage users to interact with the data, fostering a deeper understanding of the insights presented.
Many Business Intelligence reporting suites offer tools to create interactive reports, significantly enhancing the user experience and the value your reports deliver.
Step 6: Storytelling with Data
Telling a story takes raw data and turns it into an engaging narrative that motivates people to take action. By contextualizing data within a narrative, your BI reports can highlight the significance of insights, making them more relatable and persuasive.
Effective storytelling in BI reporting involves more than presenting facts; it's about weaving a narrative that connects data points to real-world business scenarios, guiding decision-makers toward informed actions.
Step 7: Testing and Feedback
Before finalizing your BI reports, testing and gathering feedback is essential. This iterative process involves presenting the report to a small, representative group of end-users and incorporating their feedback to refine the report's clarity, usability, and relevance. Continuous improvement, based on user engagement metrics and feedback, ensures that your BI reporting remains effective over time.
Step 8: Ensuring Accessibility and Compliance
Accessibility and compliance should never be an afterthought in BI reporting. Ensuring that your reports are accessible to all users, including those with disabilities, is not just a legal requirement but also expands the reach and impact of your BI efforts.
Additionally, adhering to data privacy and compliance standards is crucial in maintaining the trustworthiness of your Business Intelligence reporting suite.
Grow is fully GDPR compliant, ensuring the highest standards of data privacy and security for its BI reporting tools. This commitment includes updated privacy policies, international data transfer support, and a robust security infrastructure. For detailed information on Grow's data protection efforts, please contact privacy@grow.com.
Conclusion
Crafting BI reports that not only capture attention but also drive meaningful action is an art form that hinges on understanding your audience, setting clear goals, selecting pertinent data, designing with purpose, embracing interactivity, and storytelling—all underpinned by a commitment to continuous improvement. Utilizing BI reporting tools and suites, such as Grow, effectively, you're not just disseminating information; you're inspiring action and facilitating business success.
Grow
has been instrumental for businesses like 2 Brothers Moving &
Delivery, with the transformative power of accessible and strategic data
visualization. Their journey from complex spreadsheets to streamlined,
impactful BI reports shows the potential for any organization to enhance decision-making and operational efficiency.
We invite you to share your own stories and strategies for creating compelling BI reports. Have you discovered innovative ways to present data that truly resonates with your audience? Join the conversation below and let's learn from one another.
If you're on the lookout for tools that can elevate your BI reporting, consider exploring Grow.
With a 14-day free trial, you have the opportunity to experience firsthand how Grow can streamline your data visualization processes, making your reports not just readable, but actionable. And for a comprehensive understanding of what Grow can offer, including pricing and user reviews, a quick visit to "Grow Cost & Reviews on Capterra" can provide valuable insights.
By honing in on these crucial aspects and integrating them into your BI reporting workflow with Grow, you're poised to not just meet but surpass stakeholder expectations.
Embrace the power of Grow and ensure your BI reports become an essential facet of your organization's strategic toolkit.

Comments
Post a Comment