Why Simplified Data Manipulation is the Future of BI Dashboard Software
👉For those looking to overcome these challenges, check out our Key Strategies to Manipulate Data the Easiest Way Possible.
This reliance on outdated methods hampers decision-making and slows down the entire business process. It's clear that the future of BI dashboard software lies in simplified data manipulation. By making data handling intuitive and efficient, modern BI tools empower everyone in the organization to access real-time insights and make informed decisions quickly. This shift is not just about convenience; it's about staying competitive in an increasingly data-driven world.
The Current State of Data Manipulation in BI
Overview of Traditional Data Manipulation Techniques
When it comes to manipulating data, traditional BI dashboard software usually uses complicated procedures. These processes often include:
- ETL (Extract, Transform, Load): The conventional method, known as ETL (Extract, Transform, Load), is gathering data from various sources, cleaning it up, and then feeding it onto a business intelligence dashboard. This process requires significant technical expertise and can be time-consuming.
- SQL Proficiency: Many BI tools require users to have a strong grasp of SQL (Structured Query Language) to query databases and manipulate data. This necessity creates a barrier for business users who may not have the technical skills.
- Manual Data Cleaning and Preparation: Before data can be used in Business Intelligence dashboards, it often needs extensive cleaning and preparation, which can be a labor-intensive and error-prone task.
Challenges Faced by Users
The complexities of traditional data manipulation in BI dashboard software present several challenges:
- Steep Learning Curve: The need for technical skills such as SQL and ETL processes can be daunting for business users and even some data analysts. This learning curve can delay the time to insight and reduce overall productivity.
- Time-Consuming Processes: Manual data cleaning, preparation, and manipulation can take a significant amount of time, leading to delays in reporting and decision-making.
- Dependence on IT Teams: Non-technical users often rely on IT teams to manage and manipulate data. This dependence can create bottlenecks and slow down the process of generating actionable insights.
- Error-Prone Manual Work: Manual data manipulation increases the risk of errors, which can lead to inaccurate reporting and flawed business decisions.
The Need for Simplified Data Manipulation
- Simplified User Interfaces
Traditional BI tools often come with complex UIs that require users to have substantial technical expertise. These interfaces typically include multiple layers of menus, options, and commands that can be overwhelming for non-technical users. The complexity arises from features like SQL query panels, where users must write complex SQL queries to extract and manipulate data, and scripting languages, which are required for advanced data manipulation tasks. Additionally, users often need to perform data cleaning tasks manually using various commands and scripts, and navigating through different data sources, tables, and fields can be cumbersome.
Modern BI dashboard software, such as Grow dashboard, addresses these challenges by providing simplified UIs designed to enhance user experience and facilitate data manipulation. Simplified interfaces use intuitive designs that allow users to interact with data effortlessly. Drag-and-drop functionality, for instance, uses visual programming paradigms where users can manipulate data elements directly on the screen, eliminating the need for writing code. Users can quickly build dashboards and reports by dragging data fields, measures, and visualizations into their workspace, making this functionality intuitive and significantly reducing the learning curve.
Visual query builders enable users to generate complicated data queries using graphical interfaces. Users can select data sources, join tables, and apply filters using point-and-click actions. This approach abstracts the underlying SQL or database query language, making it accessible to non-technical users and ensuring that they can perform sophisticated data manipulations without deep technical knowledge.
Pre-built data connectors automate the integration of various data sources into the BI tool, using APIs and other integration technologies to streamline data import processes. Users can connect to databases, cloud services, and other data sources with minimal configuration, reducing the time and effort required to set up data sources and enabling quicker access to data.
Natural Language Processing (NLP) capabilities allow users to interact with the BI tool using natural language queries. Advanced algorithms parse user queries and convert them into structured database queries, enabling users to ask questions and retrieve data using simple, conversational language.
This makes data manipulation more accessible to all users, regardless of their technical background. Interactive dashboards use dynamic visual elements that respond to user inputs in real-time. Technologies like AJAX and WebSockets enable real-time data updates and interactions, allowing users to explore data by clicking on visual elements, filtering results, and drilling down into details without needing to reload or navigate away from the dashboard. This interactivity enhances user engagement and facilitates deeper data analysis.
- Efficiency and Productivity Gains
Simplified data manipulation in BI dashboard software significantly enhances efficiency and productivity, providing tangible benefits for business users, data analysts, and BI professionals. Traditional BI tools often require extensive data preparation and cleaning, which can be time-consuming and prone to errors.
In contrast, modern business dashboard software automates many of these processes, allowing users to focus on analysis and decision-making. For instance, automated data integration is a key feature of modern BI tools like Grow dashboard. This software seamlessly integrates data from multiple sources, eliminating the need for manual data consolidation. By automating data integration, Grow dashboard ensures that users have a unified view of their data, enabling more comprehensive and accurate analysis.
Real-time data processing is another crucial aspect of simplified data manipulation that enhances efficiency. With real-time capabilities, Business Intelligence dashboards can update data visualizations and reports as new data becomes available. This feature is critical for businesses that rely on up-to-date information to make timely decisions. It allows users to access the most current data without the delays associated with batch processing, thus supporting faster and more informed decision-making.
Moreover, simplified data manipulation tools in business dashboard software reduce the need for technical expertise, enabling a broader range of users to perform data analysis. Features such as drag-and-drop interfaces and visual query builders allow users to manipulate data without writing complex code or queries. This ease of use reduces the learning curve and empowers business users to generate insights independently, without relying on IT support. As a result, organizations can achieve quicker turnaround times for reports and analyses, significantly boosting productivity.
Also, by minimizing manual intervention, simplified data manipulation reduces the risk of human error in data processing. Automated data cleaning and transformation processes ensure that data is accurate and reliable, which is essential for making sound business decisions. Business Intelligence dashboards equipped with these features provide users with consistent and error-free data, enhancing the overall quality of insights generated.
- Self-Service BI and Empowerment
Simplified data manipulation plays a crucial role in enhancing self-service BI and empowering users across an organization. Modern BI dashboard software, such as Grow dashboard, is designed to reduce the reliance on IT teams by enabling business users and data analysts to handle data independently. This self-service capability is achieved through several technical innovations that make data manipulation more accessible and user-friendly.
One of the key features facilitating self-service BI is the drag-and-drop functionality found in modern business dashboard software. This feature allows users to create and customize reports by simply dragging data fields, measures, and visualizations into their workspace. By eliminating the need for complex coding and query writing, drag-and-drop interfaces empower non-technical users to perform sophisticated data analysis with ease. This accessibility is critical for democratizing data within an organization, ensuring that valuable insights are not confined to a small group of technically proficient individuals.
Visual query builders are another essential component of self-service BI in Business Intelligence dashboards. These tools enable users to construct complex data queries through graphical interfaces, using point-and-click actions to select data sources, join tables, and apply filters. By abstracting the underlying SQL or database query language, visual query builders make it possible for business users to execute advanced data manipulations without deep technical knowledge. This capability not only speeds up the data analysis process but also increases the overall efficiency and productivity of the organization.
Furthermore, the integration of Natural Language Processing (NLP) in BI dashboard software enhances self-service BI by allowing users to interact with the tool using everyday language. Users can ask questions and generate reports through natural language queries, which are then parsed by advanced algorithms and converted into structured database queries. This feature significantly lowers the barrier to entry for data analysis, making it possible for even the most non-technical users to derive insights from their data.
Pre-built data connectors also contribute to self-service BI by automating the integration of various data sources into the business dashboard software. These connectors use APIs and other integration technologies to streamline the data import process, reducing the need for manual configuration and data entry. By simplifying data integration, pre-built connectors ensure that users can quickly access and analyze data from multiple sources, further empowering them to generate insights independently.
- Enhanced Collaboration and Decision-Making
Simplified data manipulation significantly enhances collaboration and decision-making within organizations by making BI dashboard software more accessible and user-friendly. When data is easier to manipulate, users from different departments can more readily contribute to data analysis and insights generation, fostering a collaborative environment. Modern business dashboard software, such as Grow dashboard, incorporates several technical features that facilitate this enhanced collaboration.
One of the primary ways simplified data manipulation improves collaboration is through the use of interactive dashboards. These dashboards allow multiple users to interact with the same set of data in real-time, making it easy for teams to share insights and discuss findings. Features such as real-time data updates, enabled by technologies like AJAX and WebSockets, ensure that all users see the most current information, reducing the risk of miscommunication and enhancing the accuracy of collaborative efforts.
Business Intelligence dashboards also benefit from simplified data manipulation through robust data visualization options. These visualizations can be customized to meet the specific needs of different teams, allowing each group to focus on the metrics and KPIs that matter most to them. By enabling users to create tailored visualizations, BI dashboard software promotes a deeper understanding of the data across the organization. This customization capability is crucial for facilitating meaningful discussions and ensuring that all stakeholders are aligned on key business objectives.
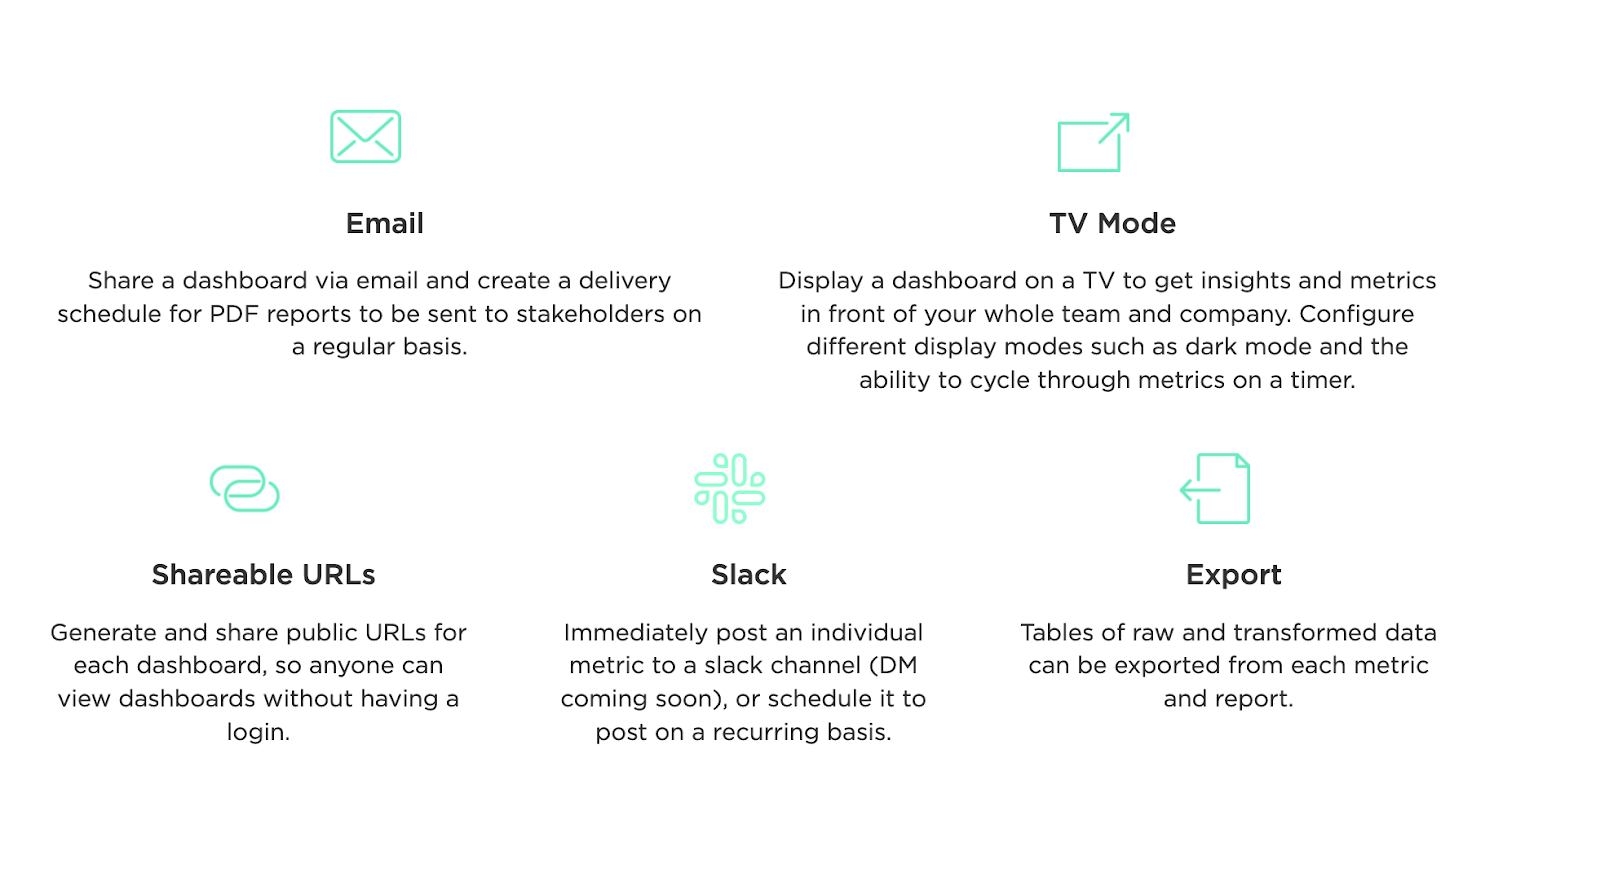
Moreover, the ability to easily share reports and dashboards within BI tools like Grow dashboard enhances collaboration by providing a transparent view of business performance. Users can create shared dashboards that display critical metrics and performance indicators, which can be accessed by colleagues across the organization. This shared access ensures that everyone is working with the same data, promoting consistency and unity in decision-making processes. The transparency afforded by shared dashboards fosters a culture of accountability and data-driven decision-making.
Simplified data manipulation also supports enhanced decision-making by reducing the time and effort required to generate insights. With features like drag-and-drop functionality and visual query builders, business users can quickly create reports and dashboards without needing to rely on IT support. This independence accelerates the data analysis process, enabling faster and more agile decision-making. When decisions need to be made swiftly, having immediate access to accurate and up-to-date data is invaluable.
Conclusion
Simplified data manipulation is undeniably the future of BI dashboard software. As organizations increasingly rely on data-driven insights to make informed decisions, the need for intuitive, efficient, and scalable BI tools becomes paramount. Modern BI solutions like Grow dashboard exemplify this shift by offering user-friendly interfaces, real-time data processing, seamless data integration with over 100 popular connectors, and advanced analytics capabilities. These features not only enhance user experience but also drive productivity, foster collaboration, and ensure that businesses can scale their operations effectively.
By adopting Grow dashboard, businesses can empower their teams to manipulate data effortlessly, generate real-time insights, and make strategic decisions with confidence. The tool's robust functionality and ease of use make it an invaluable asset for any organization looking to stay ahead in today's competitive landscape.
Don't just take our word for it—experience the power of simplified data manipulation with Grow dashboard yourself. Sign up for a 14-day free trial and see how Grow can transform your data operations. Additionally, explore what other users are saying by checking out Grow.com Reviews & Product Details on G2.
Embrace the future of Business Intelligence dashboards with Grow and see how efficient your business can really be!


Comments
Post a Comment